Updates
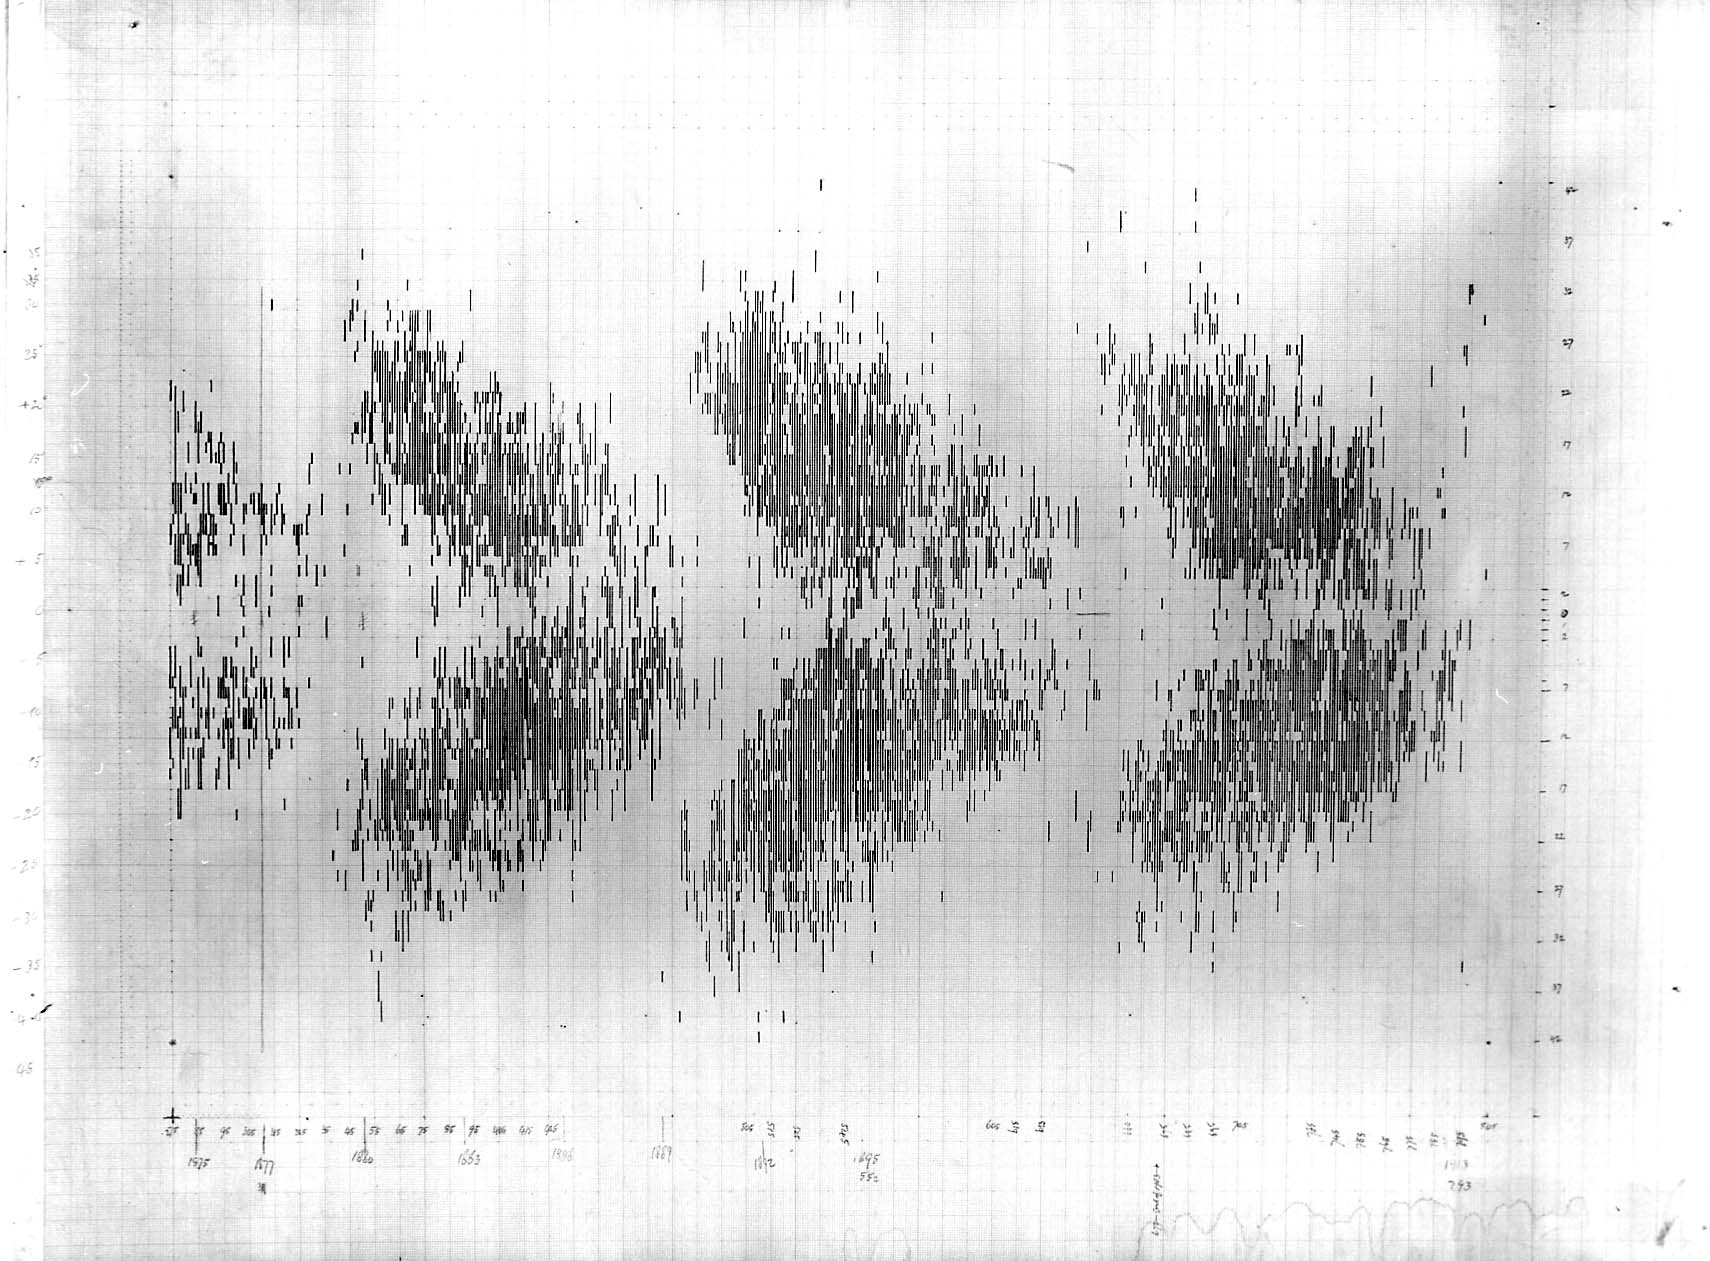
The Original Maunder Diagram
The original
butterfly diagram drawn by W. Walter Maunder and Annie S. D. Maunder
Web sites:
Pasachoff's eclipse expeditions from Williams College and elsewhere: http://www.williams.edu/astronomy/eclipse
Solar Constant On-LineThe latest
values of the solar constant as measured by the VIRGO experiment on
SOHO, along with past measurements from several spacecraft, are
available on line at or, as measured by NASA's ACRIM3 experiment on ACRIMsat, at http://www.acrim.com Solar Dynamics Observer satellite Solar Monitor Sun Watcher solar telescope on ESA's PROBA2 TRACE Satellite (defunct)The Transition Region and Coronal Explorer (TRACE) spacecraft, launched in April 1998, makes high-resolution observations of these regions of the outer solar atmosphere. TRACE Web sites are at Lockheed and at the Smithsonian Observatory. The 150-foot tower at Mt. Wilsonhttp://www.astro.ucla.edu/~obs/intro.html And if you want to see if it's clear on Mt. Wilson, check the towercam on the 150-foot tower at: http://www.astro.ucla.edu/~obs/towercam.htm From Solar News, The Electronic Newsletter of the Solar Physics Division American Astronomical Society, Volume 1999 Number 15: The 60' Solar Tower, at Mt. Wilson Observatory now provides current solar images to the internet community. Daily GIF images are provided every clear morning at: http://physics.usc.edu/solar/ Daily images include a filtergram, dopplergram, velocity map, and magnetogram in the chromospheric sodium D-line region of the solar atmosphere. All GIF images can be viewed at 256x256, 512x512, and 1024x1024 pixel resolution. The original 1024x1024 fits images, from which the gif images are processed, are also included. Past images can be searched for at; http://physics.usc.edu/solar/search_images/search.html The 60' Tower continues to acquire two 1024x1024 pixel filtergrams each minute for up to 12 hours per day. From each pair of filtergrams a full- disk dopplergram is computed later. Plots of daily hours of filtergram observations, lists of temporal coverage of computed dopplergrams, and lists of temporal coverage of multi-day time series and power spectra will be provided online in the near future.
|