Thursday, 09-Aug-2001 15:15:52 EDT
Please see my notes on the reduction process.
You can take a look at some of the relevant files in this directory, including
Two images of the partial phase (partial0.fits and partial1.fits). These were used to estimate a solar radius of 402 pixels.
Images through the each polarizer (plus broad-band and neutral density number 1 filters) (polar_*.fits). The first three images (ordered by the last number in the file name) through each polarizer are 1-second exposures, the last two are 3-second. NOTE: fits files have been updated. All pixel value should be correct, now.
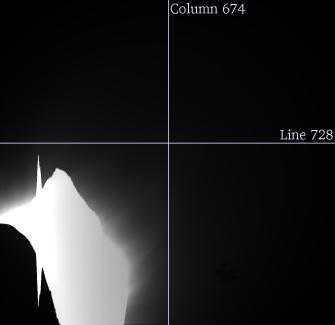
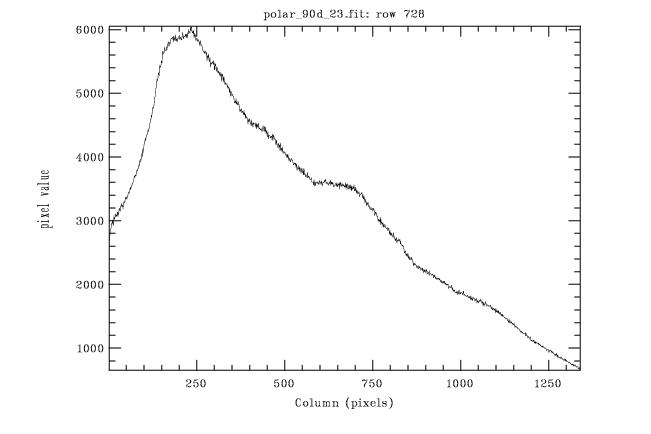
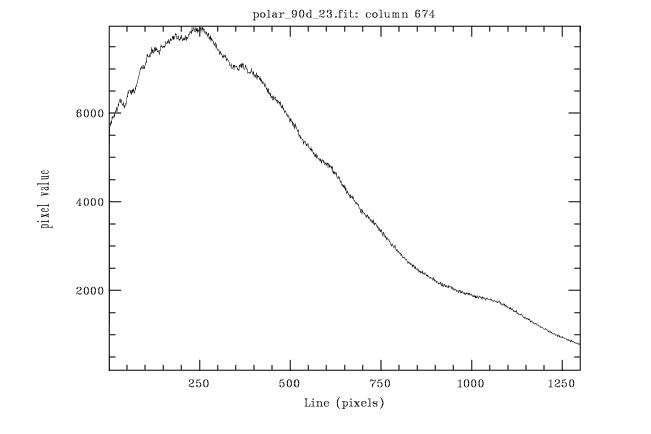
Cross sections of a 3-second image from each polarizer (sgi*.eps). The point (column,line)=(674,728) is about 2.5 solar radii NE of the limb. All the 3s exposures seem to have between 3000 and 6000 counts in this region.
|
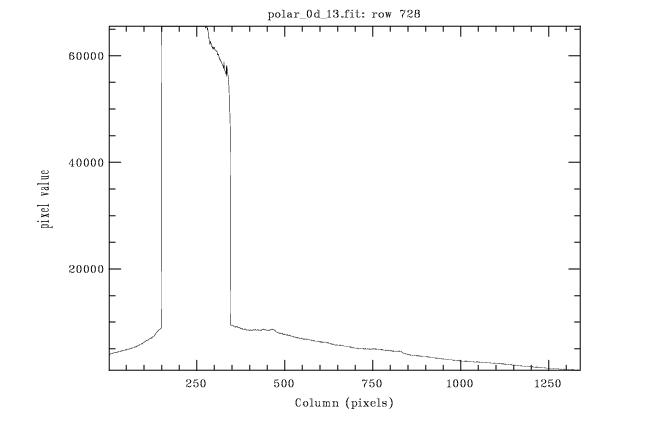
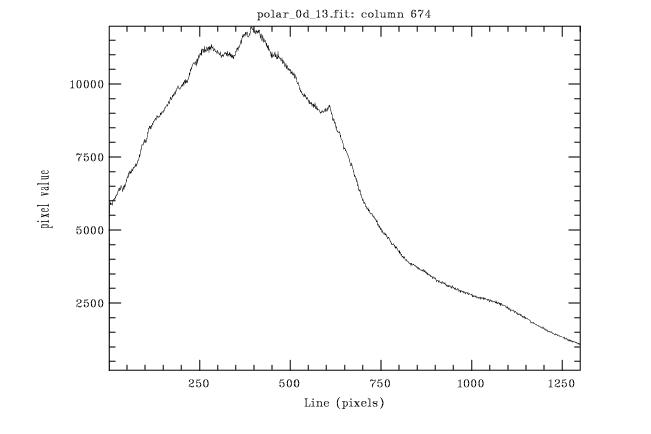
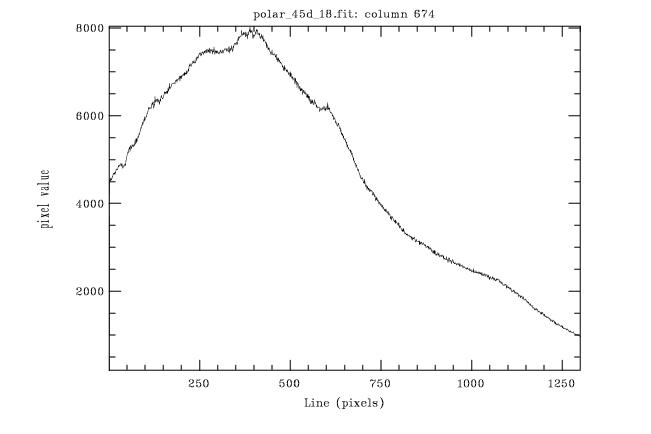
| The following graphs are slices through 3 different images. There is a pair of graphs for each image, one slice through column 674, one through line 728. The slices are indicated in this picture. In this image, column number increases from left to right, line number increases from bottom to top. Each plot along column 674 starts at the bottom of the image and plots counts versus line number along the indicated vertical line. The left axis of each graph is the number of counts. Similarly, each plot along line 728 starts at the left of the image and follows the horizontal line to the right edge. |

List the files.
Roban Hultman KramerThursday, 09-Aug-2001 15:15:52 EDT